
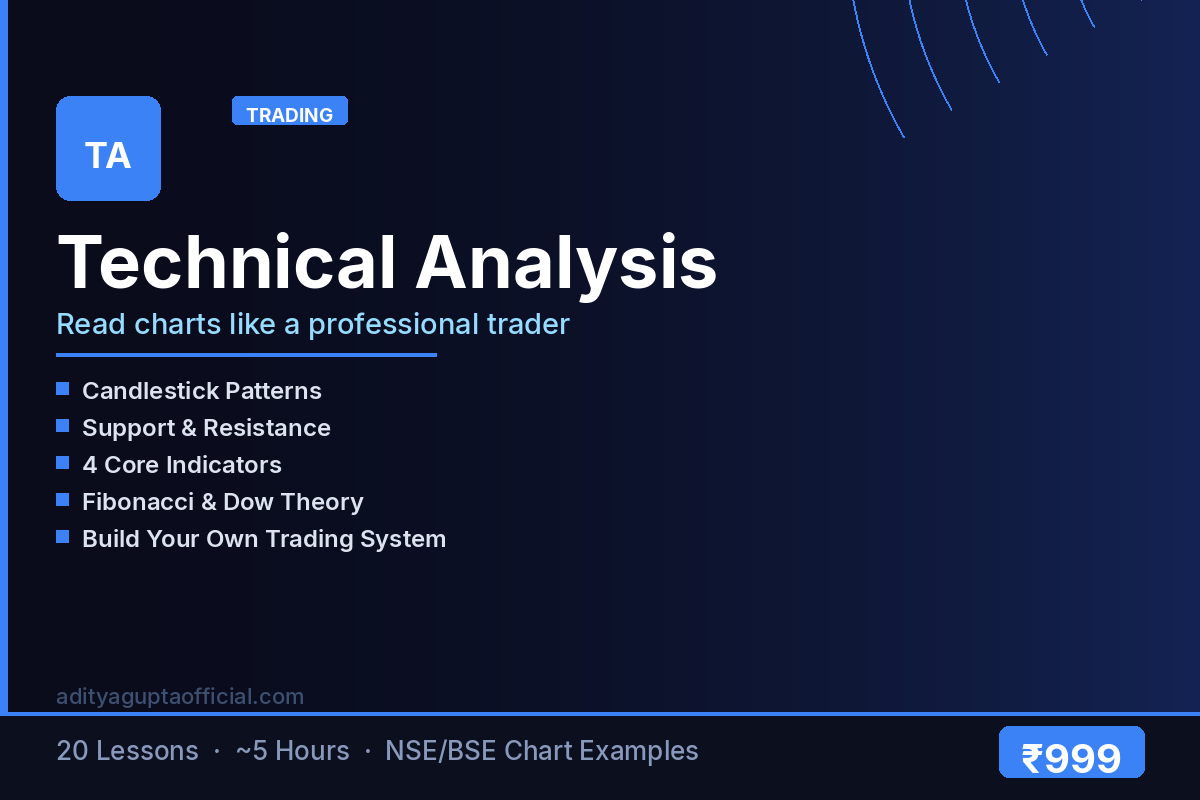
What you will learn
Build the chart-reading muscle every active trader needs. The course walks you from your very first candlestick to a complete trading system you can deploy on Indian indices, large-caps, and the F&O list. You will work through real charts pulled from Nifty 50 and Bank Nifty so the context is always relevant to a desk trader in Mumbai or a swing trader in Bengaluru.
By the end you will be able to read a price chart in seconds, identify high-probability setups, place stops and targets methodically, and sit on a trade with conviction instead of fear.
Topics covered (20 lessons)
- Foundations: market structure, chart types, the role of price action
- Candlestick patterns — single, dual, and triple-candle formations
- Volume, support & resistance, supply-demand zones
- Indicators: Moving Averages, RSI, MACD, Bollinger Bands
- Fibonacci retracements & extensions
- Dow Theory (Part 1 & 2)
- Building your first repeatable trading system
- A trader’s journal and pre-market checklist
Who this is for
- Anyone trading or planning to trade equities, F&O, or commodities on NSE/BSE/MCX
- Long-term investors who want to time their entries better
- Self-learners moving on from YouTube to a structured curriculum
What you will be able to do by the end
- Read a candlestick chart and recognise what a single candle is telling you (Lessons 3–7)
- Identify multi-candle patterns and the context that makes them meaningful (Lessons 8–10)
- Mark support and resistance that hold up, and use volume to confirm them (Lessons 11–12)
- Apply moving averages, RSI, MACD and Bollinger Bands without over-fitting them (Lessons 13–15)
- Use Fibonacci retracements as a level framework rather than a prediction (Lesson 16)
- Apply Dow Theory to identify trend structure (Lessons 17–18)
- Assemble a checklist-driven trading system of your own (Lesson 19)
Full curriculum — all 20 lessons
Every lesson in the course, in the order you will take them. This is the complete list — there is nothing held back.
- Overview & Setting Expectations
- Foundations of Technical Analysis
- Chart Types
- Getting Started with Candlesticks
- Single Candlestick Patterns — Part 1
- Single Candlestick Patterns — Part 2
- Single Candlestick Patterns — Part 3
- Multiple Candlestick Patterns — Part 1
- Multiple Candlestick Patterns — Part 2
- Multiple Candlestick Patterns — Part 3
- Support and Resistance
- Volumes
- Moving Averages
- Indicators — RSI
- Indicators — MACD, Bollinger Bands & More
- Fibonacci Retracements
- Dow Theory — Part 1
- Dow Theory — Part 2
- Building Your First Trading System
- Notes for the Trader
How the course is structured
Twenty lessons, built so that pattern recognition comes before indicators — not the other way round.
- Foundations (Lessons 1–3). What technical analysis can and cannot do, its assumptions, and chart types.
- Candlesticks (Lessons 4–10). Seven lessons — three on single patterns, three on multiple patterns. The largest block in the course.
- Structure (Lessons 11–12). Support and resistance, then volume.
- Indicators (Lessons 13–16). Moving averages, RSI, MACD and Bollinger Bands, Fibonacci retracements.
- Theory and practice (Lessons 17–20). Dow Theory across two lessons, building your first trading system, and closing notes.
Lesson 19 is the point of the course: everything before it feeds a system you can actually follow.
What you need before you start
None beyond knowing what a share and a stock chart are. Lesson 1 sets expectations honestly, including what technical analysis does not do.
What is included
- 20 written lessons — roughly 38000 words in total, with a typical lesson running around 1,905 words
- Worked Indian-market examples throughout, in rupees and against Indian instruments and regulations
- Self-paced access — start when you like, revisit any lesson, no schedule to keep up with
Where this sits among the courses
This is the chart-reading track. It stands alone.
- Complementary: Fundamental Analysis answers what to buy; this course is about when.
- If you trade the signals: Risk Management & Trading Psychology covers position sizing and the biases that undo good analysis.
Frequently Asked Questions
Do I need any trading experience to take this course?
No prior experience required. The first 4 lessons establish foundations — if you can open a chart on Zerodha Kite or Groww, you can follow along from Lesson 1.
Is this course India-specific?
Yes. Every example uses Indian indices, stocks, and brokerage screens so the application is immediate for NSE/BSE participants.
How long does the course take to complete?
Most learners finish within 4–6 weeks at 3–4 lessons per week. Lessons are self-paced and remain accessible after purchase.
What’s the difference between this and the Options Theory course?
Technical Analysis teaches you to read price across any instrument; Options Theory is focused on options pricing, Greeks, and strategy mechanics. Pair them for a complete derivatives toolkit.
Will I get certificates or live mentorship?
This is a self-paced article-based program. No certificates, no live calls — just structured, in-depth lessons you can revisit forever after purchase.
Is technical analysis actually reliable?
Lesson 1 addresses this directly and sets expectations rather than overselling. The course treats charts as a framework for structuring entries, exits and risk — not as prediction.
Why so many lessons on candlesticks?
Seven of the twenty. Candlestick patterns are where most self-taught chartists learn shapes without context, and misread them as a result. Three lessons on single patterns and three on multiple patterns give the context the shapes need.
Do I need charting software?
Any charting platform your broker provides is enough. The course teaches what to look for, not how to operate one specific tool.
Already purchased? Go to course content →


Reviews
There are no reviews yet.